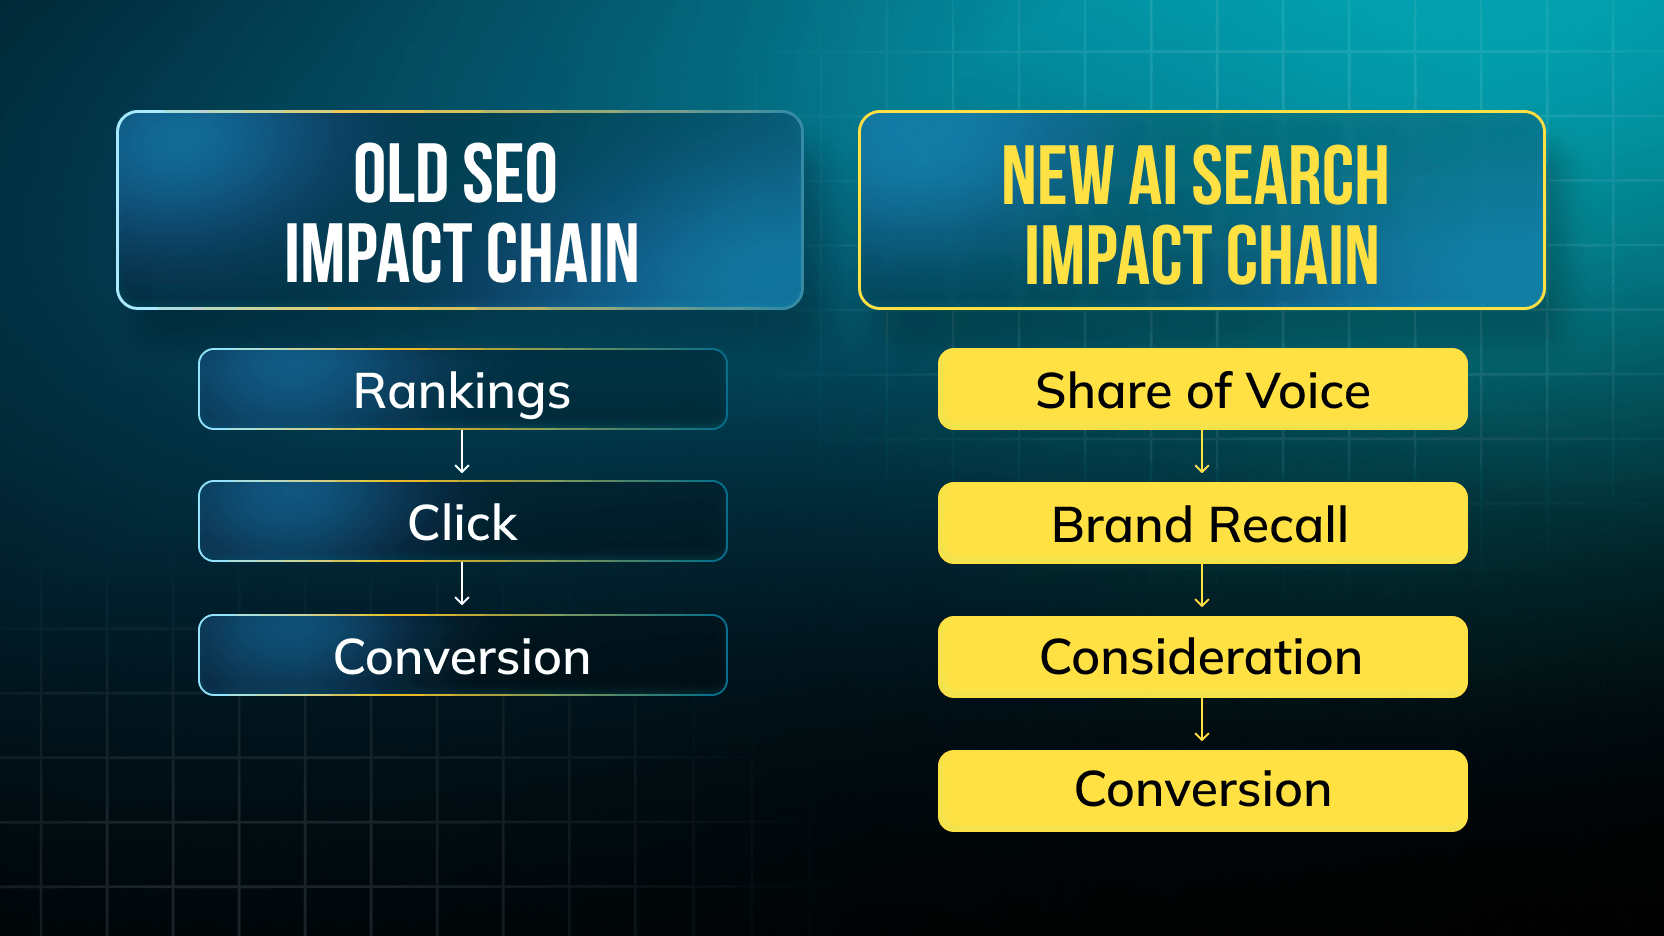
Content
Your monthly SEO report says 412 keywords improved and 389 declined.
So, is it working?
At keyword level, you can't answer that. You can only scroll.
The problem isn't your data, it's the unit of analysis. Google doesn't evaluate your website one keyword at a time, and neither do Large Language Models (LLMs) like ChatGPT, Gemini or Claude when they decide which vendors to recommend. They see and understand you in connection to “topics”. Therefore, your reporting should too.
This article explains why topic-level tracking matters for both Search Engine Optimisation (SEO) and AI visibility, how it connects to topical authority, and how to put it into practice. You also get the free Python script I built for exactly this: it turns thousands of keywords into a handful of topics you can actually act on.
What is a keyword?
A keyword is a specific string of words someone types into a search engine.
What is a topic?
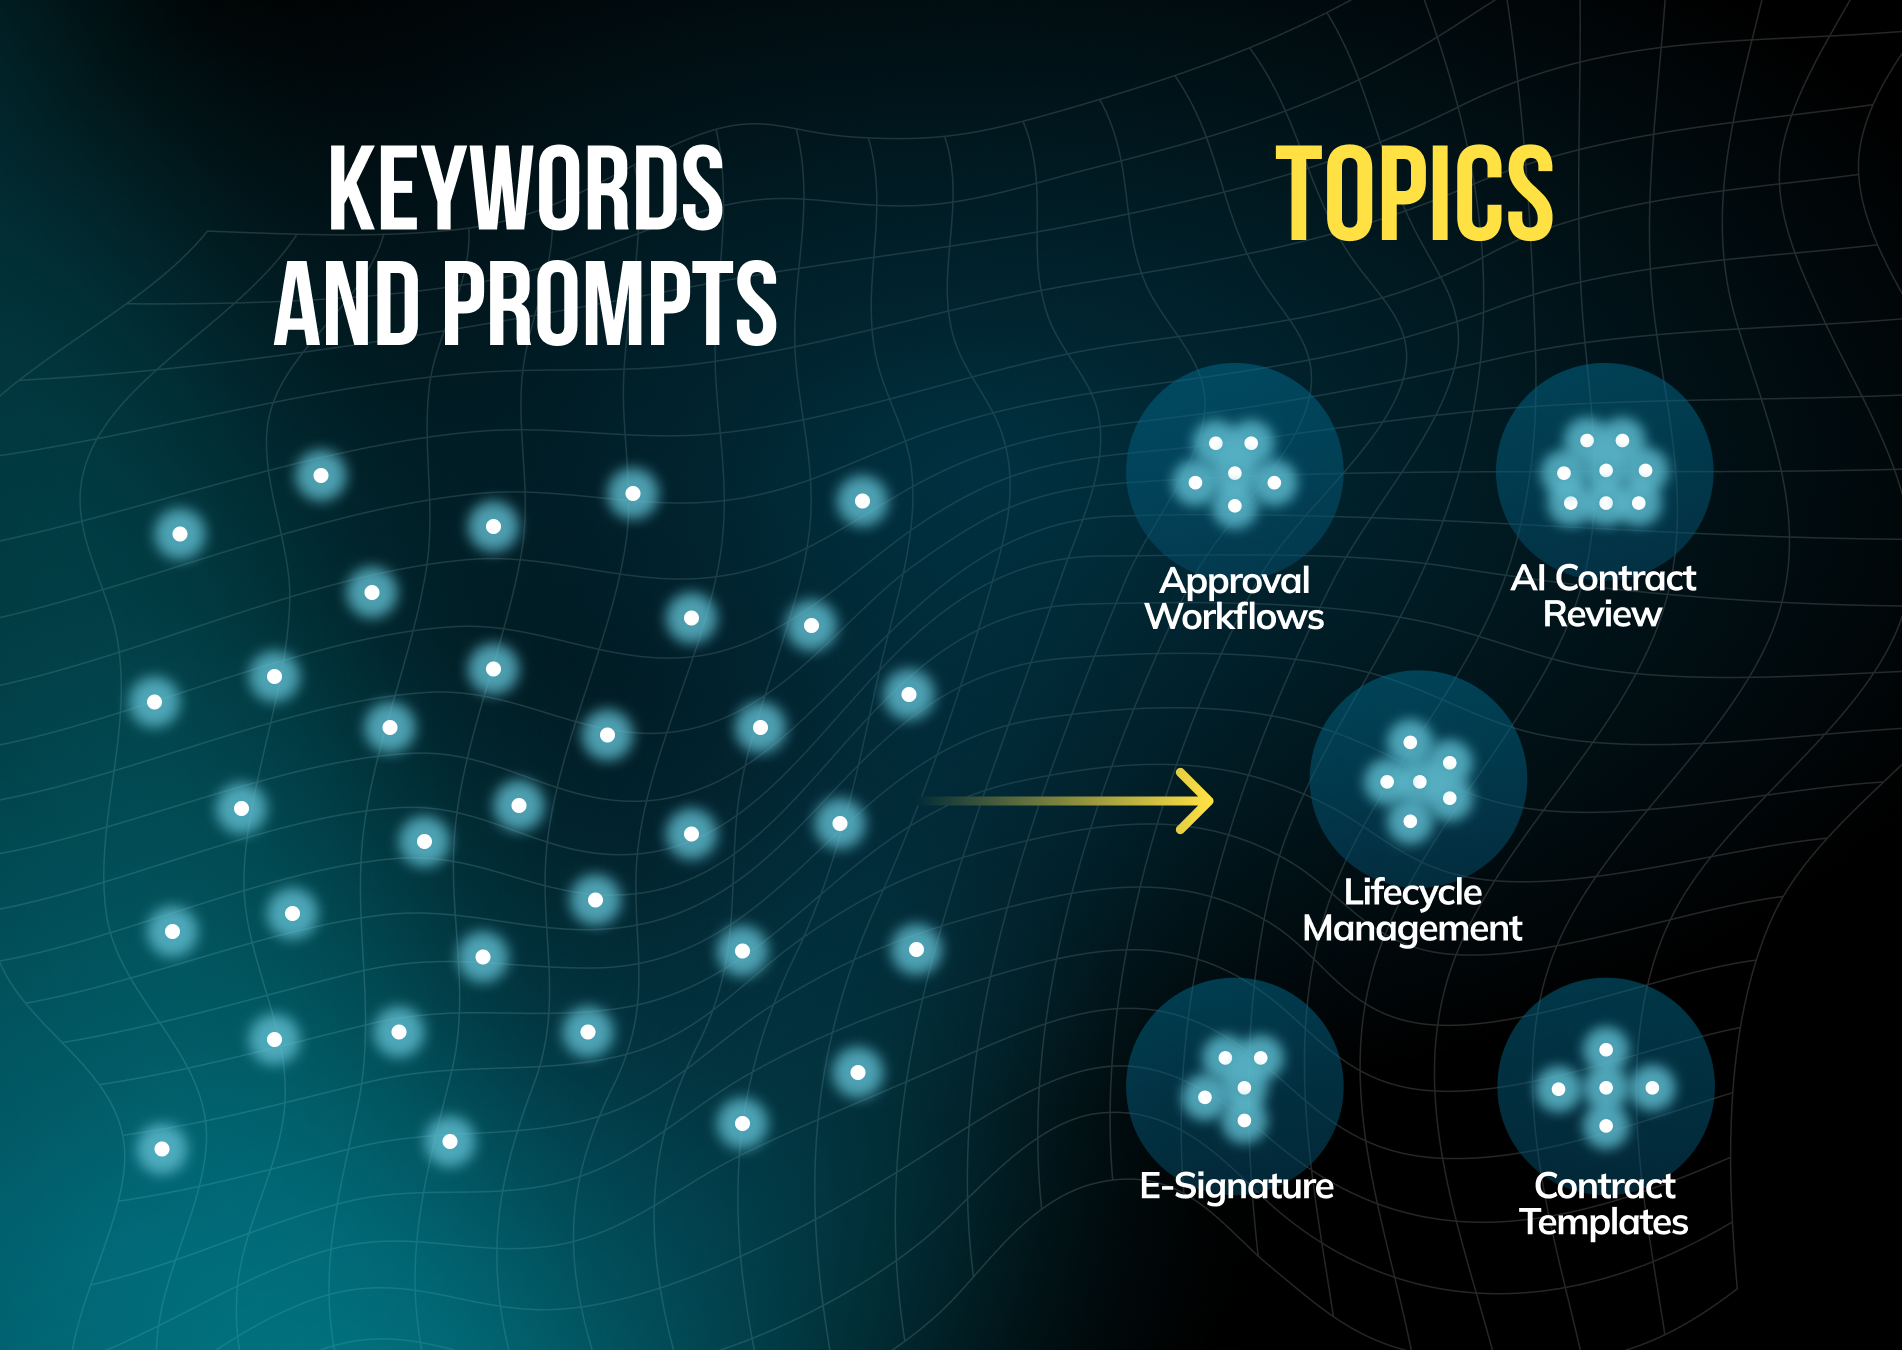
A topic is a subject area defined by meaning rather than wording. It covers all the queries, prompts, questions and subtopics that share an underlying need.
What is topical grouping?
Topical grouping is the process of clustering individual keywords or AI prompts into topics based on their meaning. It lets you analyse performance at the level search engines and LLMs use to understand your company.
What is topical authority?
Topical authority is the degree to which search engines and AI systems associate your brand with a subject and trust you as a source for it. It is earned through the depth and consistency of your coverage, on your own website and in third-party mentions, not through any single page or keyword.
TL;DR:
The essentials at a glance
- Keyword-level reporting hides trends. Individual keywords and prompts are volatile and fragmented. Real gains and losses only become visible when you aggregate them by topic.
- Search engines and LLMs understand you in “topics”. Google maps content to entities and topics. LLMs learn which brands belong to which subjects and retrieve sources per subtopic when answering. Consistent topic association is what gets you ranked, cited and recommended.
- The same principle applies to keywords and prompts. Search Console keywords and prompts from AI visibility tools like Peec AI can be grouped with exactly the same method. Only the metrics differ.
- Four signals matter. Gaining, declining, new and lost topics each point to a different cause and a different action, and the priority depends on how closely a topic maps to your pipeline.
- You can start today. Our free Google Colab script groups your Search Console keywords into topics and shows which ones gain or lose traction. It can be adapted for AI prompts with a few changes.
Why keyword-level reporting breaks down
Keywords are the wrong unit of analysis. They are too volatile, too fragmented and too numerous to tell you what is actually happening.
A mid-sized B2B SaaS website easily ranks for several thousand queries. Most of them bring a handful of clicks each. Positions move daily because of personalisation, SERP feature changes, algorithm updates and competitors publishing new content.
At that level, almost every movement is noise. And the few signals that matter are buried under it.
Take a fictional contract management software company. Its keyword report shows 40 keywords around contract approval, each losing between one and three clicks. Nobody flags it, because no single keyword moved enough to matter.
Grouped together, those 40 keywords tell a different story: the topic “contract approval workflows” lost 30% of its clicks in one quarter. That's a strategic problem, and it was invisible at keyword level.
Google Search Console (GSC) data makes this even harder:
- A large share of queries is anonymised and never appears in query exports.
- The standard interface export is limited to 1,000 rows.
- Long-tail variations of the same intent are listed separately, splitting one demand signal into dozens of rows.
AI visibility tracking is even more fragmented. Prompts tracked in AI visibility tools are synthetic. In most cases, there is a very low chance a real buyer types exactly your tracked prompt, and the answer to a single prompt can change from one run to the next. Treating a single prompt like a ranking keyword is just the wrong approach. Treating a cluster of 30 related prompts as one topic is a solid foundation for decision making.
How search engines and LLMs actually see your website
Neither Google nor LLMs evaluate your website keyword by keyword, but they build an understanding of which topics you belong to.
Search engines: entities, topics, and the knowledge graph
Google moved from matching strings to understanding meaning years ago. Its Knowledge Graph stores entities (companies, products, people, concepts) and the relationships between them. Language models like BERT help it interpret what a query means, not just which words it contains.
For your website, this means Google isn't asking “does this page contain the keyword?” It's asking “which topics does this site cover, how deeply, and how consistently?”
The 2024 leak of Google's internal Content Warehouse API documentation made this tangible. It referenced site-level attributes such as siteFocusScore and siteRadius, which appear to describe how focused a site is on its core topic and how far individual pages drift from it. Nobody outside Google knows exactly how these are weighted. But the direction is clear: topical focus is evaluated at site level, not only at page level.
LLMs: associations learned in training, sources retrieved at answer time
LLMs don't calculate a topical authority score. But they use two similar mechanisms:
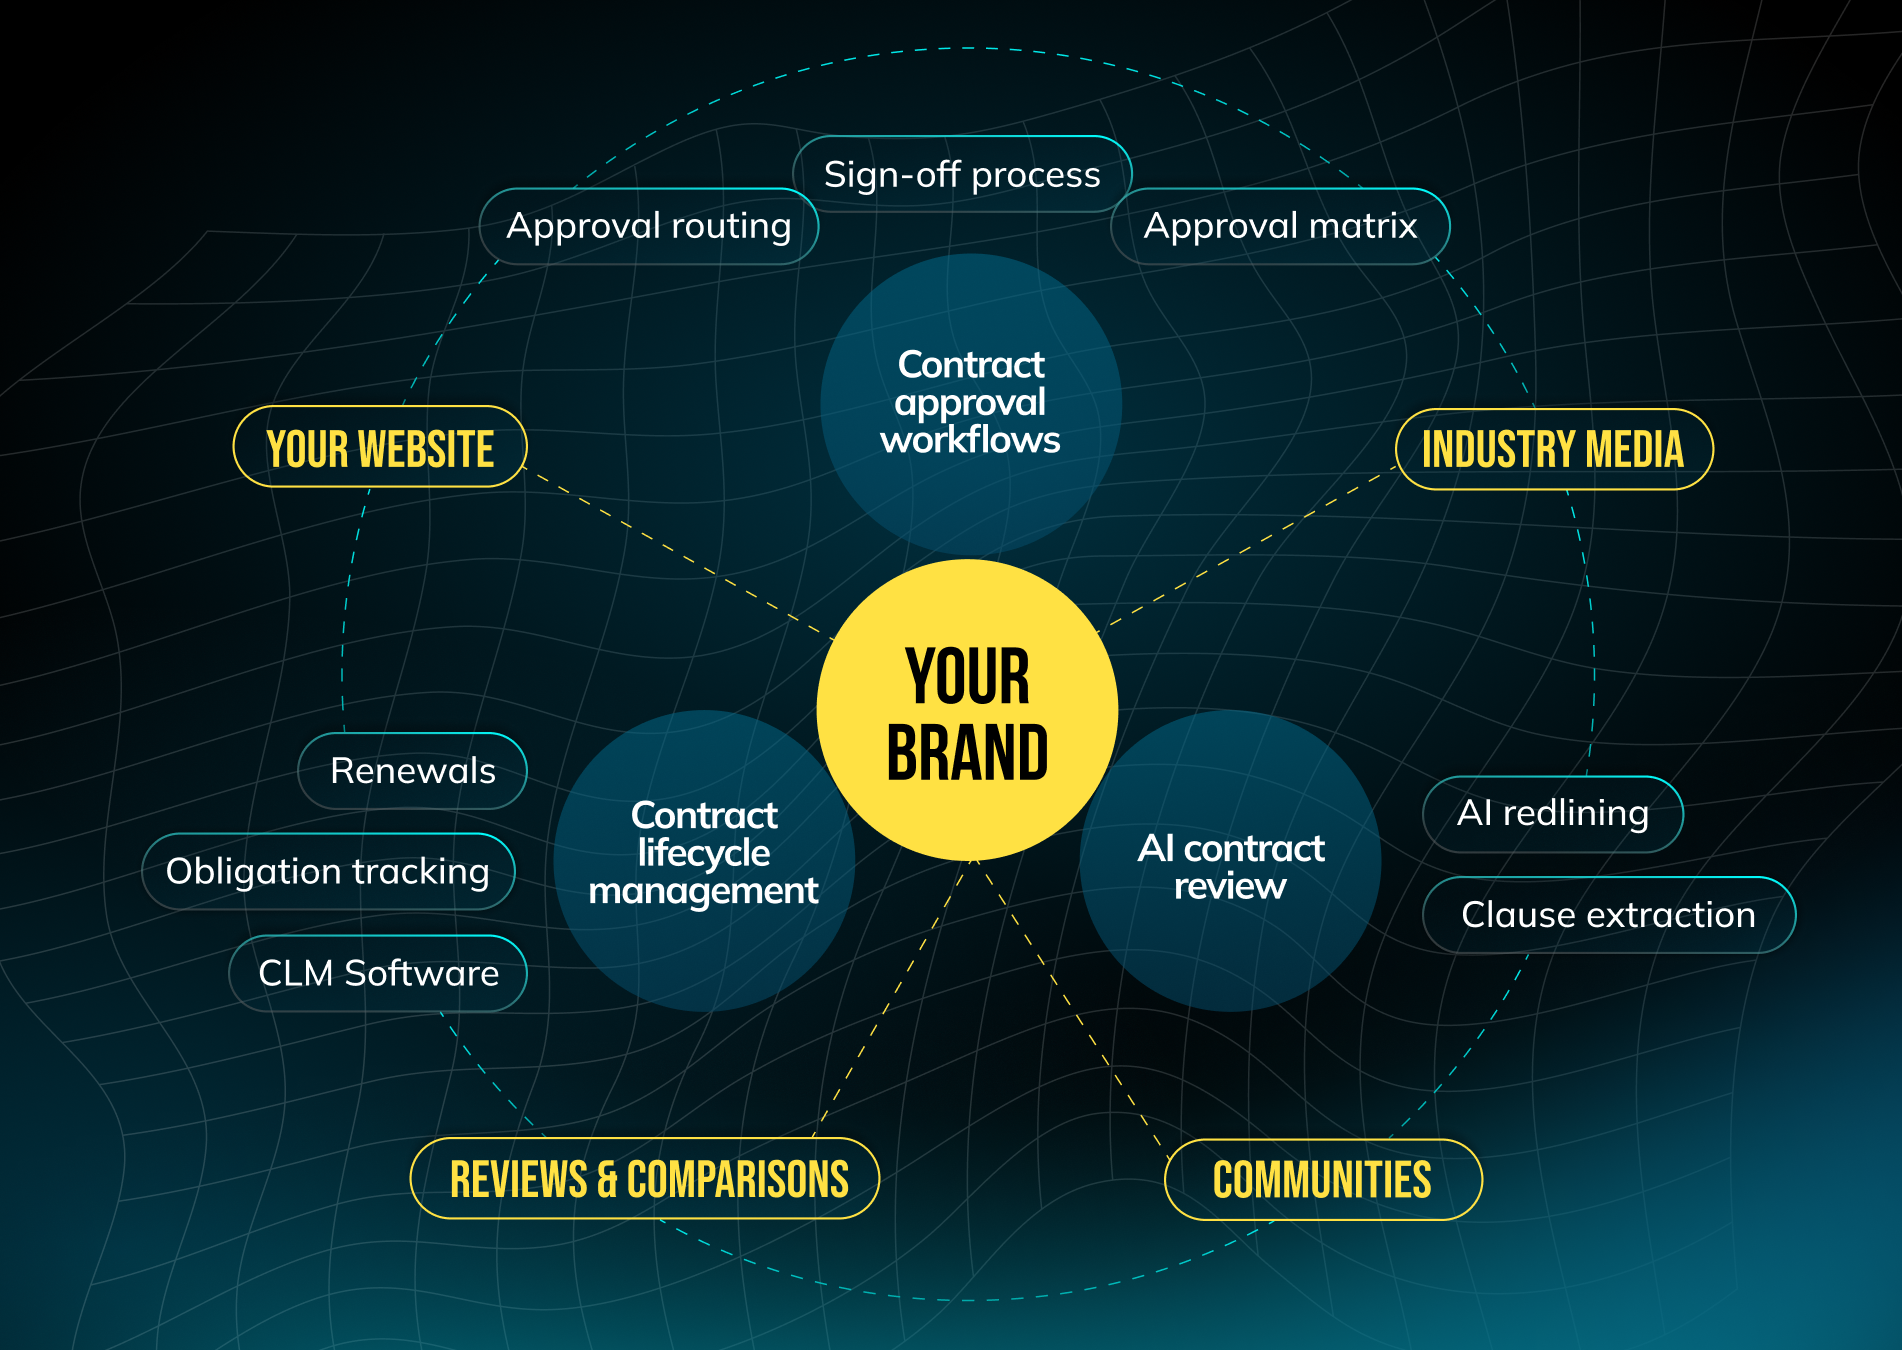
- Training data: During pre-training, a model learns statistical associations from an enormous volume of text. If your brand repeatedly appears together with a topic across your website, industry publications, reviews, comparisons and community discussions, the model learns that association. If you're mentioned once in passing, it barely learns anything.
- Retrieval at answer time: When AI search products like ChatGPT search, Perplexity or Google's AI Overviews answer a question, they often break it into several sub-queries, a process known as query fan-out, and retrieve sources for each. A brand with deep coverage of the whole topic has far more chances to be retrieved and cited across those sub-queries than a brand with one strong page.
The result is the same in both cases: brands that are consistently associated with a topic get recommended more often. Brands with scattered, keyword-driven content usually don't.
That's why topical authority is not an SEO concept that AI made obsolete. It's the bridge between SEO and AEO, the practice of improving your visibility in AI-generated answers. And it's why performance should be measured at topic level.
Keywords and prompts: same principle, different inputs
Whether you track Google rankings or AI visibility, the grouping logic is identical. Only the metrics change.
The method is based on semantic embeddings: numerical representations of meaning. “Contract approval process” and “how to set up approval workflows for contracts” share few words, but their embeddings sit close together because they mean nearly the same thing. That works for a three-word keyword just as well as for a 25-word prompt.
{start-table}
Category
- Typical source
- What you track
- Typical volume
- Performance metric
- Position metric
- Additional signals
- Volatility of a single item
SEO keywords
- Google Search Console
- Real user queries
- Thousands to tens of thousands
- Clicks, impressions
- Average ranking position
- Click-through rate (CTR)
- Moderate
AI prompts
- AI visibility tools such as Peec AI
- A defined set of tracked prompts
- Dozens to a few hundred
- Visibility (share of answers mentioning your brand), share of voice
- Average position of your brand within AI answers
- Cited sources, sentiment
- High
{end-table}
This is also why a combined view becomes so powerful. For each topic, you can see whether you win in Google, in AI answers, in both, or in neither.
What topic-level tracking reveals that keyword tracking hides
Once keywords are grouped, four signals emerge. Each one points to a different cause and a different action.
- Gaining topics: clicks or visibility grow across the cluster. This shows which content investments work and where doubling down will likely pay off.
- Declining topics: a cluster loses clicks, rankings or visibility. Common causes are content decay, a competitor publishing stronger content, cannibalisation between your own pages, or AI Overviews absorbing clicks.
- New topics: a topic that didn't exist in the comparison period. This can be the result of new content, but also of new demand you haven't deliberately targeted yet. In our fictional example, “AI contract review” appears as a new topic without a dedicated page. That's a content opportunity handed to you by your own data.
- Lost topics: a topic that brought clicks before and brings none now. Often a sign of deleted or redirected pages, technical issues, or a topic you simply stopped covering.
The real value comes from connecting topics to business outcomes. Not every topic deserves the same attention. A declining topic that maps directly to your Ideal Customer Profile (ICP) and comes up in active sales conversations is an emergency. A declining topic that mostly attracted students is not.
For Sales-Led companies in particular, this is how topic-level reporting connects to the pipeline. We cover that side in detail in our article on Organic Growth for Sales-Led SaaS.
How it works under the hood and how to apply it in practice
The script turns two Google Search Console exports into an interactive topic report. No manual tagging, no regex rules, no predefined topic list.
Here is what happens when you run it:
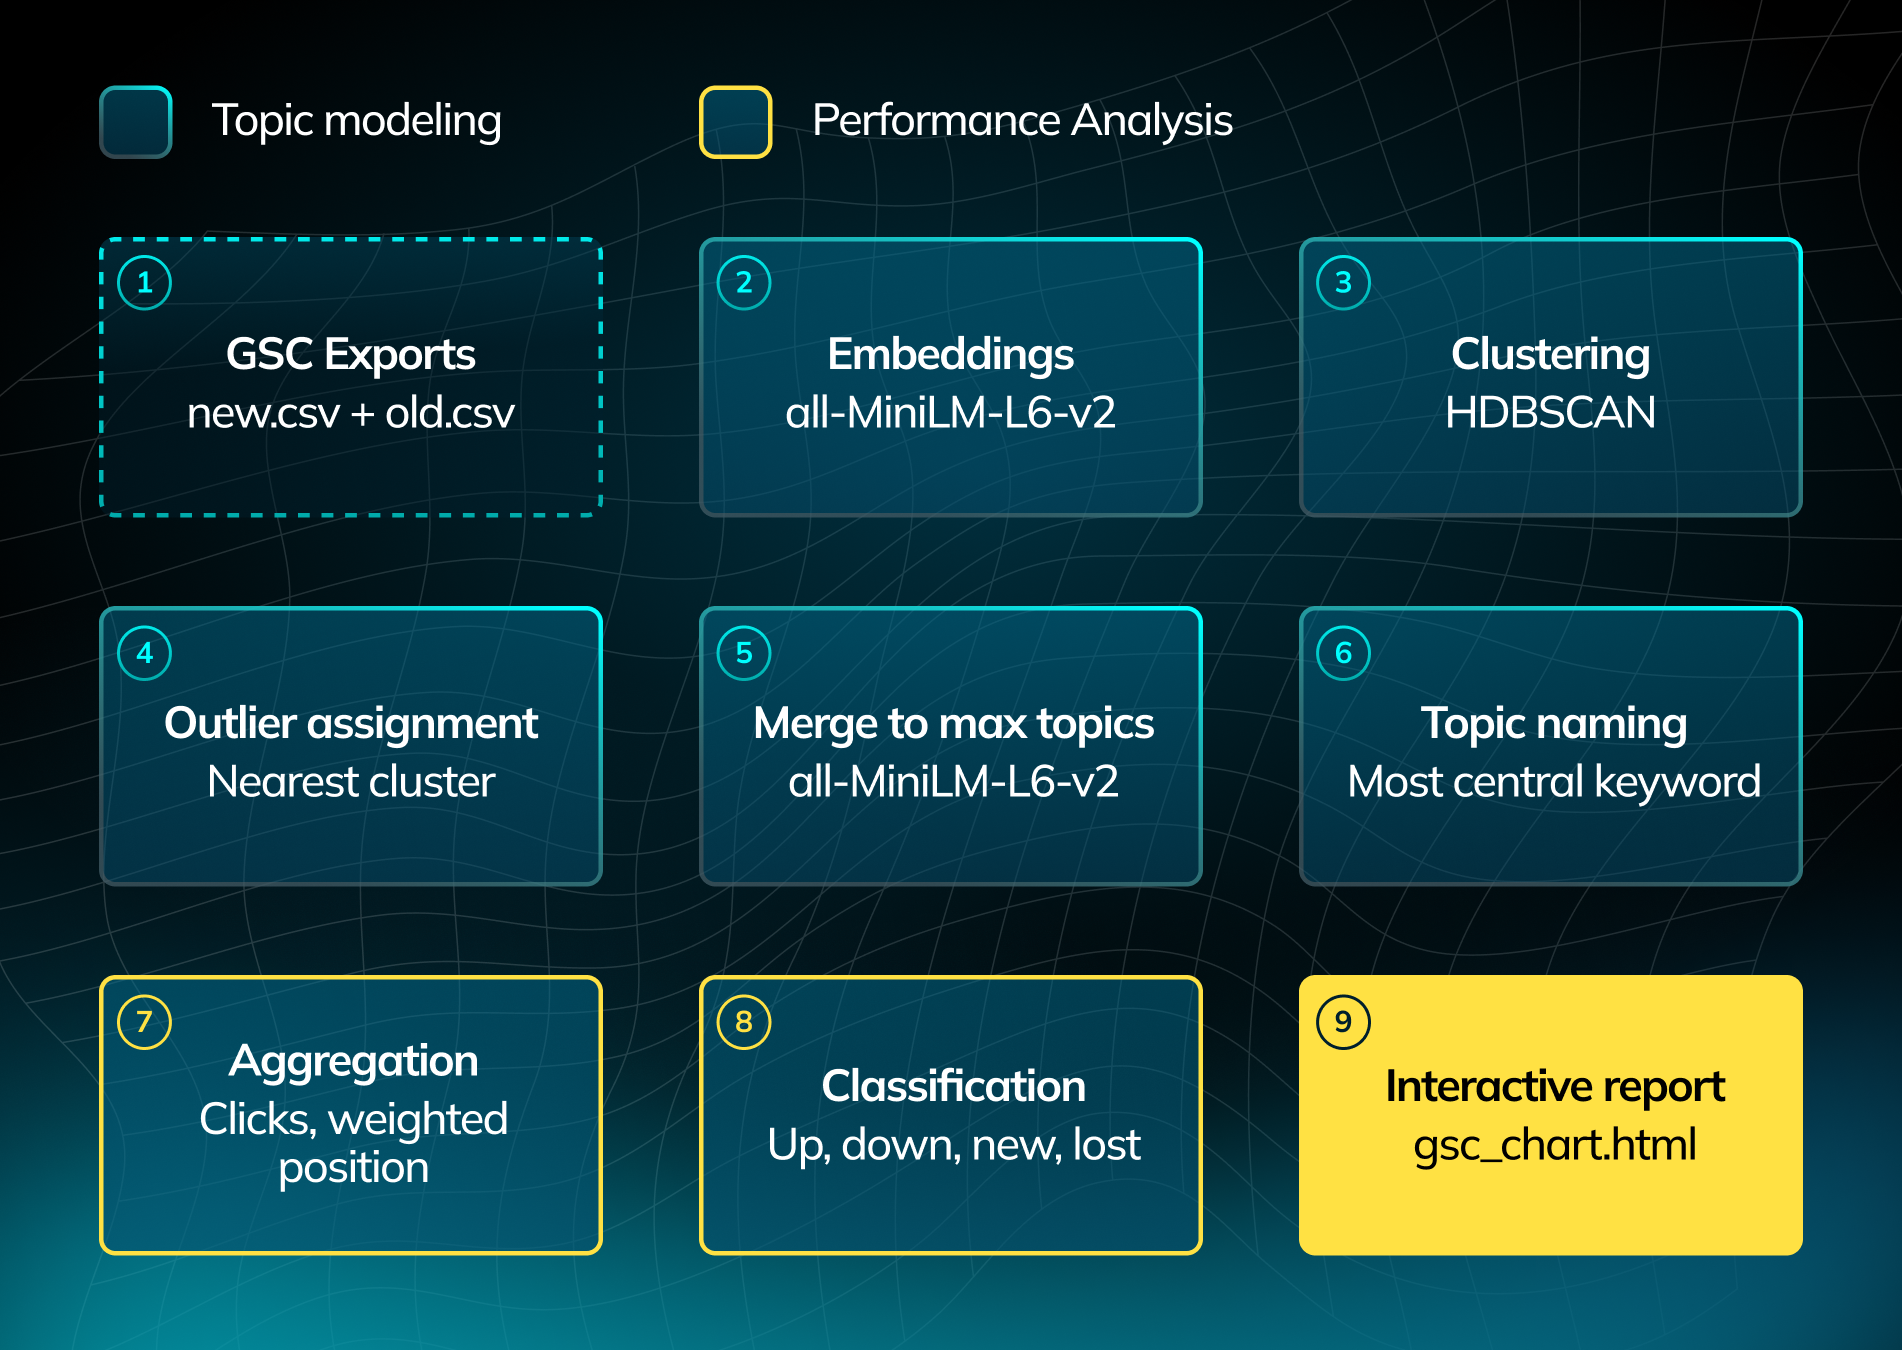
- Load two periods. You upload two GSC query exports: the current period (new.csv) and a comparison period (old.csv).
- Understand meaning. Every unique keyword is converted into a semantic embedding using the open-source all-MiniLM-L6-v2 model. Keywords with similar meaning end up close to each other, even if they share no words.
- Find natural clusters. HDBSCAN, a density-based clustering algorithm, groups the keywords. Unlike k-means, you don't need to define the number of clusters upfront. The algorithm finds the structure that is actually in your data.
- Assign outliers. Keywords that don't clearly belong anywhere are assigned to the nearest cluster, so no clicks disappear into an “Other” bucket.
- Merge to your chosen number of topics. You set a maximum number of topics, and the script repeatedly merges the two most similar clusters until that limit is reached.
- Name each topic. Each topic is named after its most central keyword, the one closest to the cluster's centre of meaning.
- Aggregate performance. Clicks are summed per topic. Position is calculated as a click-weighted average, so keywords that drive traffic influence the topic position more than keywords nobody clicks on.
- Classify and visualise. Each topic is classified as increased, decreased, new or lost, then plotted in an interactive chart with drill-down tables.
Why embeddings instead of string matching? Traditional grouping relies on shared words or n-grams (word combinations). That puts “contract approval software” and “expense approval” in the same group while separating “contract sign-off process” from it. Embeddings group by meaning, which is exactly how search engines and LLMs interpret your content.
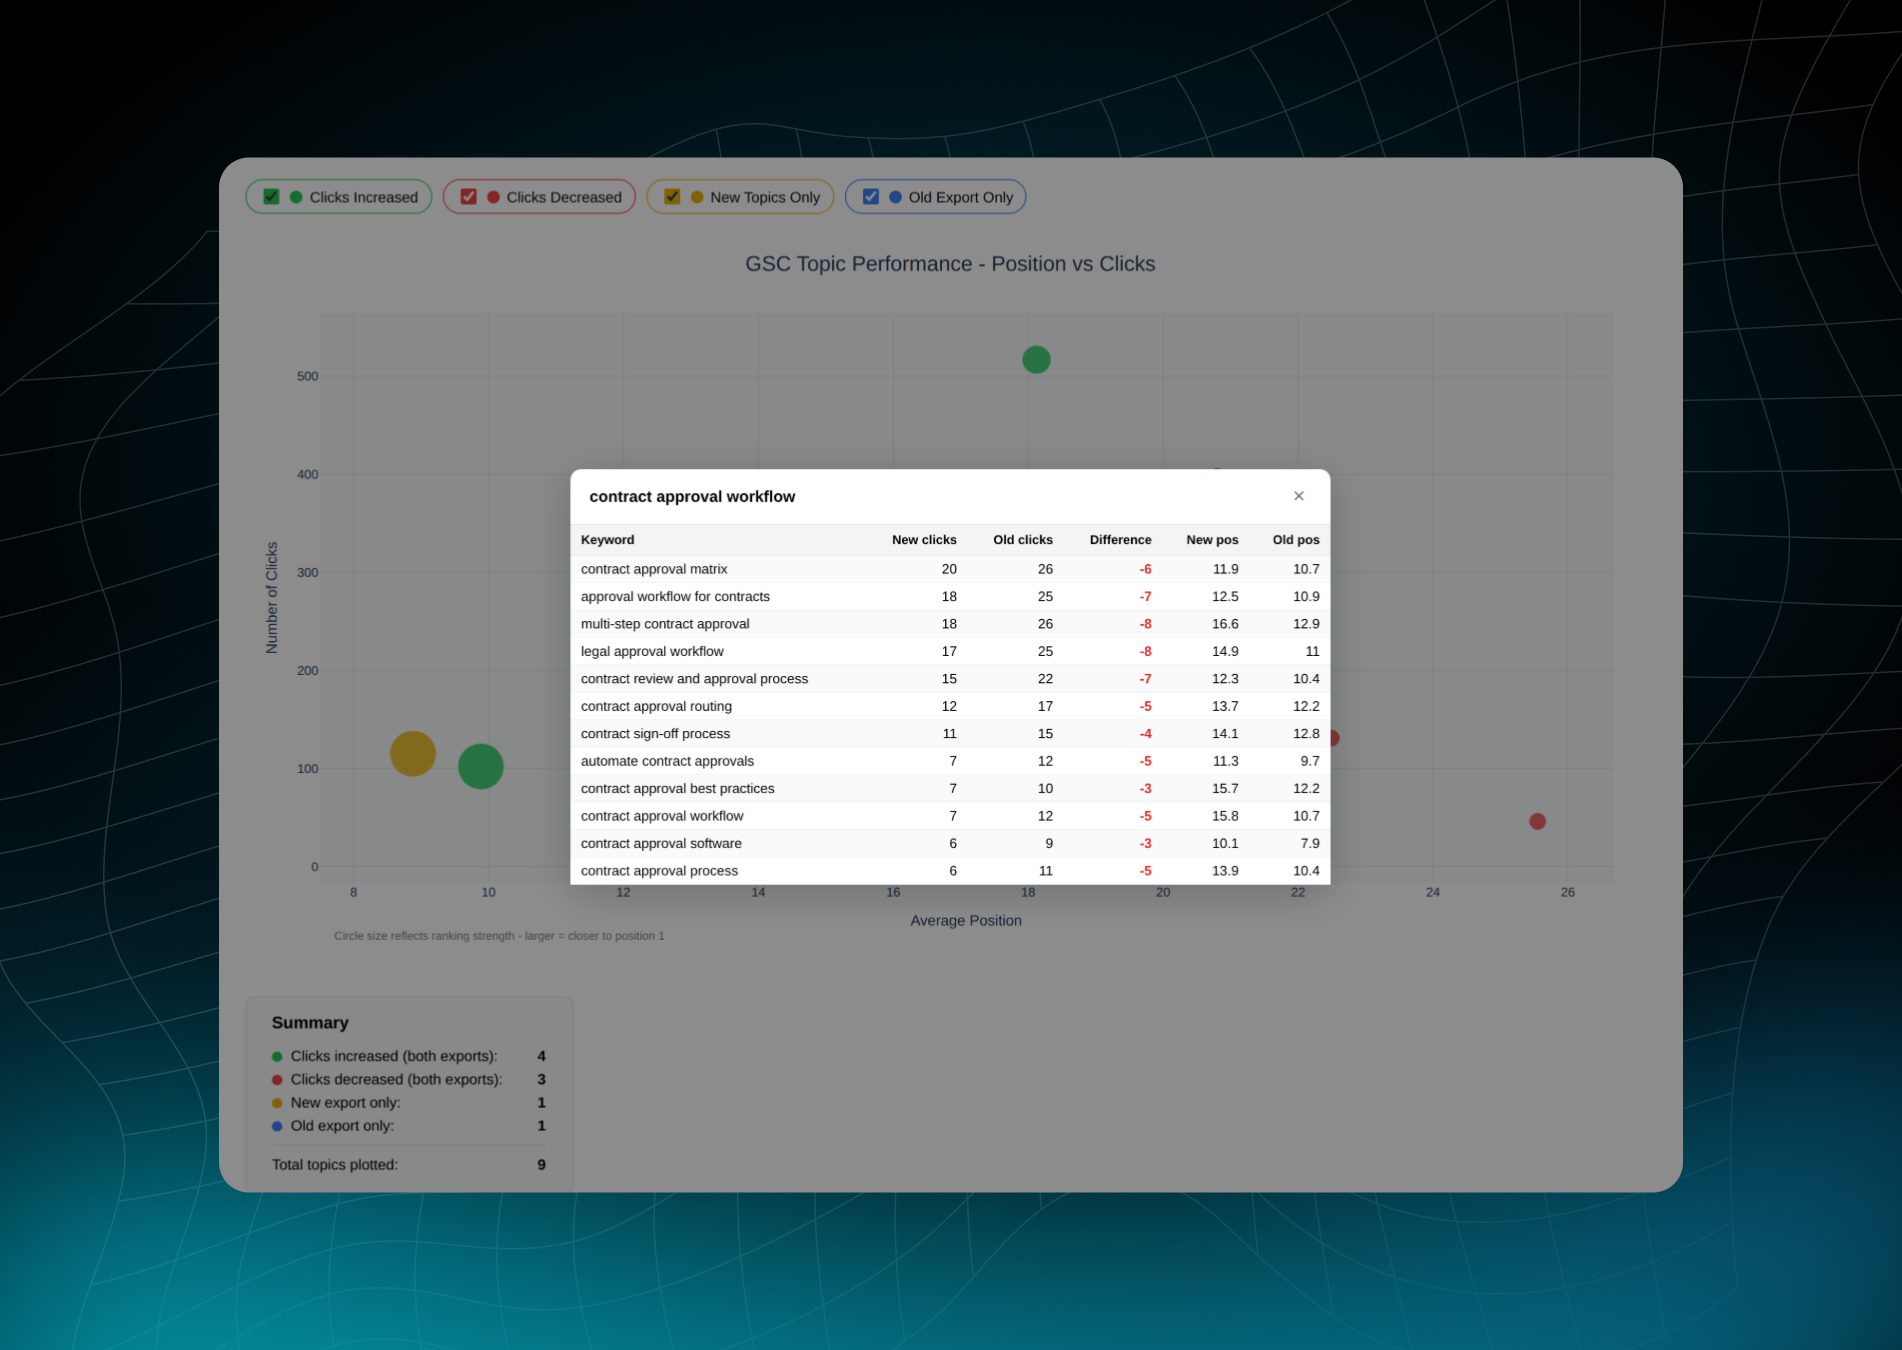
How to run the script in Google Colab
You don't need a Python environment or coding experience. Everything runs in your browser.
- Export two comparable periods from GSC. In Search Console, open Performance, then Search results, set the date range and export. The export is a ZIP file, and the file you need is Queries.csv. Repeat for the comparison period.
- Use periods of equal length.
- Compare year on year (YoY) where possible to neutralise seasonality.
- The GSC interface exports a maximum of 1,000 rows. For larger sites, use the Search Console API, the BigQuery bulk export or a tool like Search Analytics for Sheets.
- Rename the files. Name the current period new.csv and the comparison period old.csv. The script recognises the standard GSC column names automatically.
- Open the script in Google Colab and upload both files via the Files panel (folder icon in the left sidebar).
- Run the cell. Dependencies install automatically. The first run takes a few minutes because the embedding model has to be downloaded.
- Set the maximum number of topics when prompted. As a starting point:
- Up to 500 keywords: 10–20 topics
- 500 to 5,000 keywords: 20–40 topics
- More than 5,000 keywords: 40–80 topics
- Open the report. The script saves gsc_chart.html in the Files panel. Download it, open it in any browser and share it with your team.
Too few topics and unrelated themes get merged. Too many and you're back to noise. Run it twice with different values and keep the version where every topic makes sense to a human reader.
Troubleshooting: If your export is very small or the keywords are very diverse, HDBSCAN may not find any clusters at all, and the script stops with an error. In that case, use a longer date range or a larger export, or lower min_cluster_size from 3 to 2 in the clustering settings.
{{cta}}
How to read the results and what to do next
The report answers one question at a glance: which topics are moving, in which direction, and how much traffic (or AI share of voice) is at stake?
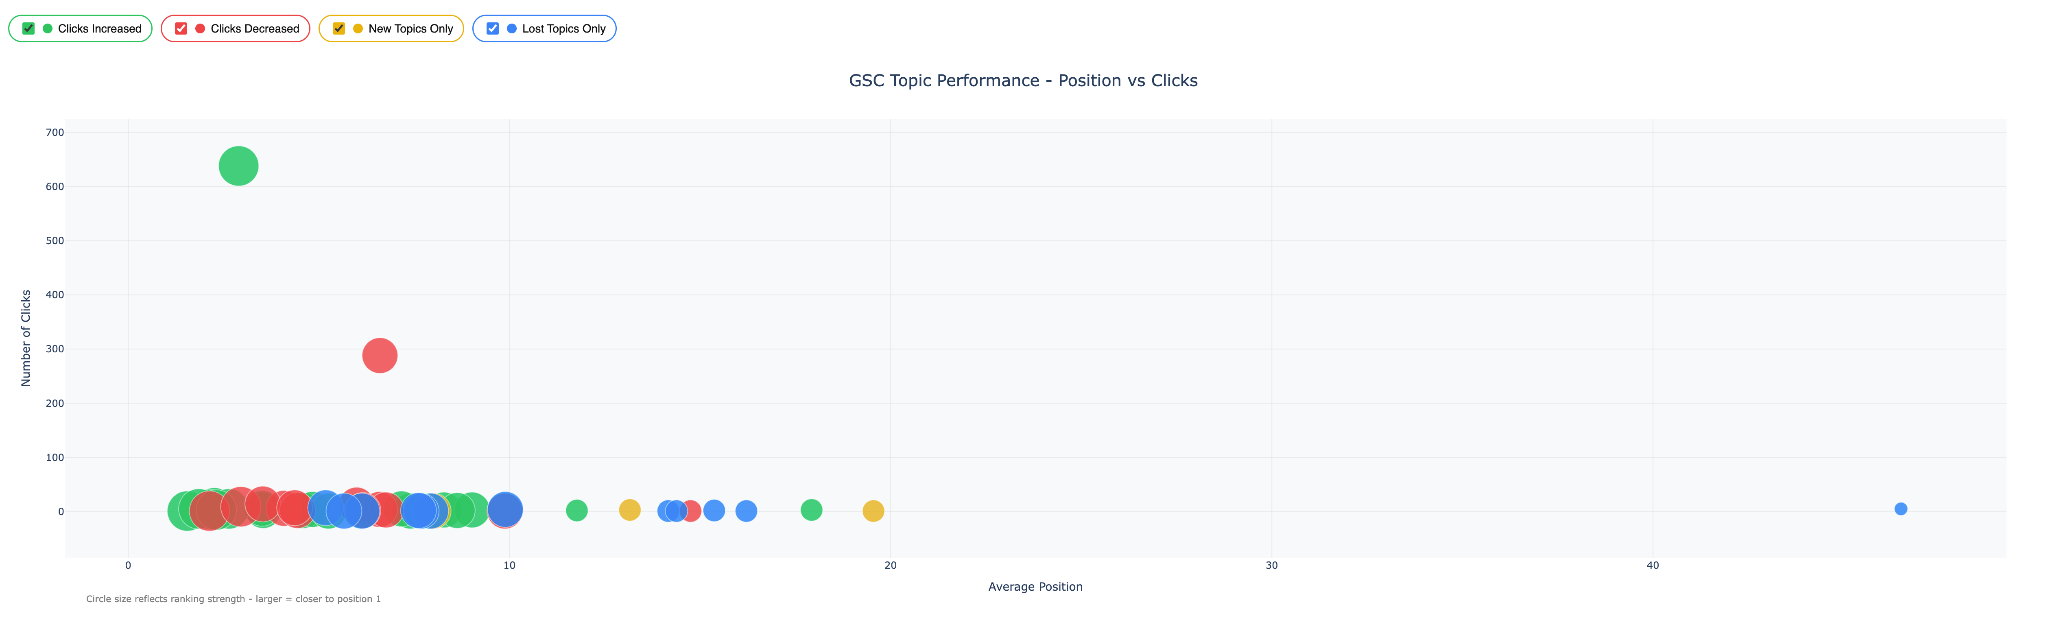
In the chart:
- Horizontal axis: average position of the topic. Further left means better rankings.
- Vertical axis: number of clicks.
- Bubble size: ranking strength. Larger bubbles are closer to position 1.
- Colour: green for increased clicks, red for decreased, yellow for new topics, blue for topics found only in the old export. Checkboxes let you show or hide each category.
Hover over any bubble to see old and new clicks and positions. Below the chart, four tables list every topic per category, sorted by impact. Click any topic to see the individual keywords behind it, with clicks and positions for both periods.
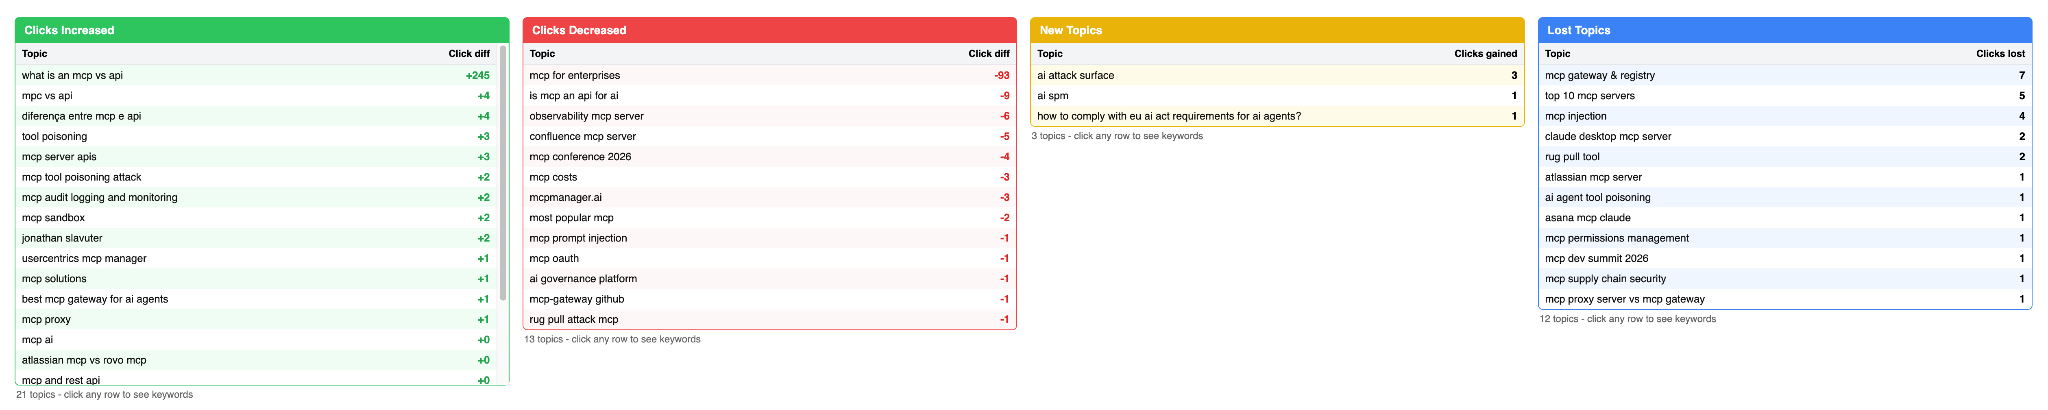
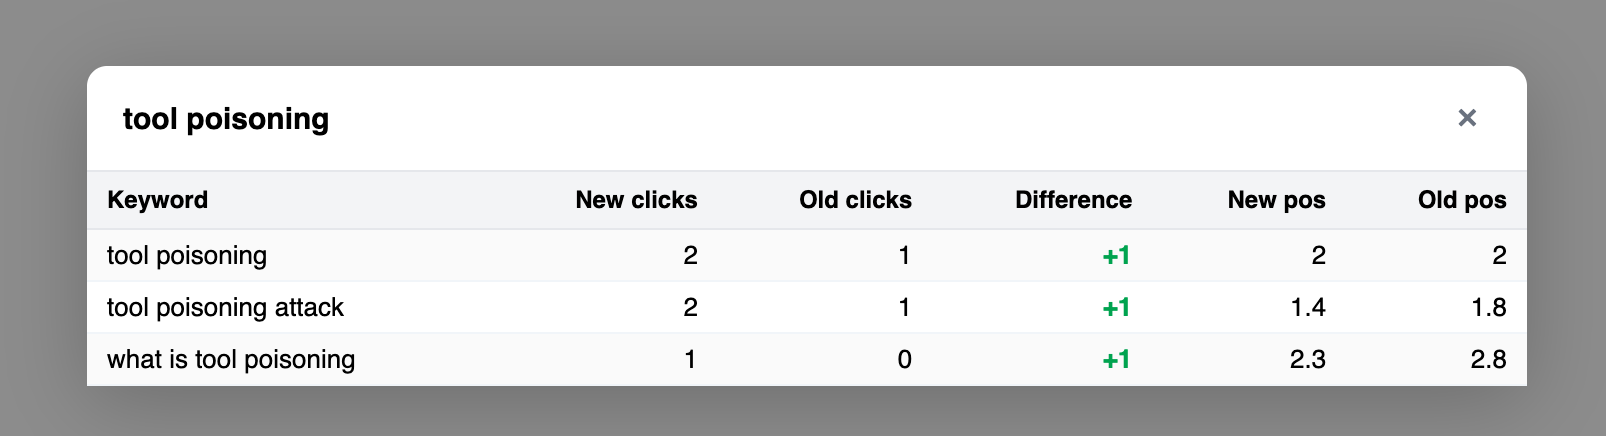
The most important distinction is whether a topic lost clicks because its position dropped or because something else changed. That's why the matrix below splits declining topics in two.
{start-table}
Signal
- Gaining topic
- Declining topic, position dropped
- Declining topic, position stable
- New topic
- Lost topic
What you see
- More clicks, stable or better position
- Fewer clicks, worse position
- Fewer clicks, similar position
- Clicks only in the current period
- Clicks only in the comparison period
Likely cause
- Content investment paying off, growing demand
- Content decay, stronger competitor content, cannibalisation
- Lower demand, AI Overviews or other SERP features absorbing clicks
- New content, emerging demand
- Deleted or redirected pages, technical issues, dropped coverage
Recommended action
- Expand coverage with supporting content, strengthen internal links, make sure conversion paths exist
- Refresh or consolidate content, compare with the pages now outranking you, check whether several of your pages compete for the same topic
- Check impressions and the SERP layout, shift effort towards AI visibility for this topic
- Validate business relevance, build a dedicated page or content cluster if it fits your ICP
- Check indexing and redirects, then decide deliberately whether to rebuild or let it go
{end-table}
Adapting the script for AI prompts (Peec AI)
The same script works for AI visibility with a few adjustments, because the grouping logic doesn't care whether the text is a keyword or a prompt.
AI visibility tools like Peec AI track how often and where your brand appears in AI answers for a defined set of prompts. Most of these tools let you assign prompts to topics manually. The script adds value where manual tagging reaches its limits: when your prompt set grows, when you want an objective, meaning-based grouping, or when you want one taxonomy across SEO and AI data.
To adapt it:
- Export prompt-level data for two periods, with at least the prompt text, your brand's visibility and its average position.
- Map the columns. Add the prompt column to the rename map in the loading function (for example “prompt” to “query”), and map visibility to the metric the script currently reads as clicks.
- Change how the metric is aggregated. Clicks are summed per topic. Visibility is a percentage, so it should be averaged per topic instead. Update the chart labels at the same time.
- Adjust the bubble sizing. The size brackets are built for Google positions, which run from 1 to 100. Brand positions in AI answers usually sit between 1 and 10, so tighten the brackets.
- Lower the minimum cluster size. Prompt sets are much smaller than keyword sets. A min_cluster_size of 2 usually works better than the default of 3.
- Use a multilingual model for multi-language projects. If you track prompts in several languages, replace all-MiniLM-L6-v2 with a multilingual model such as paraphrase-multilingual-MiniLM-L12-v2. Prompts with the same meaning in different languages then land in the same topic.
The most valuable step comes after that: run keywords and prompts through the same taxonomy. Then you can see, per topic, whether you win in Google, in AI answers, in both, or in neither. A topic where you rank well but stay invisible in AI answers is one of the clearest GEO opportunities you'll find.
Limitations and how to take it further
The script is a diagnostic tool, not an autopilot. Knowing its limits makes the output more reliable.
- Clusters are semantic, not intent-based. “Contract management software” and “what is contract management” may land in the same topic, even though one is commercial and the other informational. Review the drill-down and split topics where intent matters.
- Topic names are suggestions. The most central keyword isn't always the best label. Rename topics before you share results with stakeholders.
- Topics shift between runs. Clustering is recalculated every time, based on the keywords in both exports. That's fine for a one-off analysis, but not for ongoing reporting. For monthly or quarterly tracking, save the keyword-to-topic mapping once and reuse it, so you compare the same topics over time.
- Very small datasets can break clustering. As mentioned above, HDBSCAN may find no clusters at all in very small or very diverse exports. Use more data or lower the minimum cluster size.
- Positions are approximations. GSC positions are already averages, and the script adds a click-weighted average on top. Use them to judge direction, not as exact values.
- Anonymised queries are missing. Clicks from anonymised queries don't appear in query exports, so topic totals will be lower than your overall GSC clicks.
Ways to take it further:
- Map topics to URLs. Add the page dimension from GSC to see which pages carry each topic and where cannibalisation happens.
- Add impressions and CTR. This separates demand changes from ranking changes.
- Automate the pipeline. Pull data via the Search Console API and feed the results into Looker Studio for recurring topic-level reporting.
- Improve topic names with an LLM. Pass each cluster's top keywords to a model and ask for a short, human-readable label.
Lorem ipsum dolor sit amet
Lorem ipsum dolor sit amet, consectetur adipiscing elit. Suspendisse varius enim in eros elementum tristique.
Get the free topical grouping script
The Google Colab script groups your Search Console keywords into topics in minutes and shows you which ones are gaining traction and which ones are losing it.
THe Bottom Line
From topical grouping to topical authority
Topical grouping shows you where you stand. Topical authority is what you build with that knowledge.
The report tells you which topics you own, which you're losing and which you haven't claimed yet. Building authority on top of that means:
- Covering your core topics completely, from definitions to detailed comparisons and implementation questions.
- Connecting that content through internal links, so search engines understand how your pages relate to each other.
- Earning mentions and citations beyond your own website, in industry media, reviews, comparisons and communities. That is where much of what LLMs learn about your brand comes from.
- Focusing on topics that map to your ICP and your pipeline, not on everything you could rank for.
Keywords and prompts will keep fluctuating. Topics are what search engines and LLMs remember you for.
So measure them.
Your questions answered
What is topical authority, and can you measure it?
Topical authority describes how strongly search engines and AI systems associate your brand with a subject. There is no official metric. You can measure proxies: aggregated clicks, rankings and AI visibility per topic, the share of relevant subtopics you cover, and how often you are cited for the topic in AI answers.
How many topics should I choose?
It depends on the size of your dataset. As a rule of thumb: 10–20 topics for up to 500 keywords, 20–40 for up to 5,000, and 40–80 above that. The right number is the one where every topic makes sense to a human reader.
Does the script work with non-English keywords?
The default model is trained mainly on English text. For German or multilingual data, replace it with a multilingual model such as paraphrase-multilingual-MiniLM-L12-v2. No other changes are needed.
Can I use the script with Peec AI or other AI visibility tools?
Yes. The grouping logic works for any text. You need to map the prompt and metric columns, average visibility instead of summing it, adjust the bubble sizing and lower the minimum cluster size. The steps are described above.
How often should I run the analysis?
Monthly for operational monitoring and quarterly for strategic decisions. For recurring reporting, fix your topic taxonomy after the first run so you compare the same topics every time.
Is my data sent to any third party?
The script runs entirely inside your Google Colab session. The embedding model is downloaded into the notebook and runs there, so your keywords aren’t sent to any external API.